
In 2020, 62% of global online sales took place on marketplaces. With the holiday season around the corner, the surge in online shopping spurred by the pandemic is showing no signs of slowing down. As shoppers continue to browse, compare and purchase on their favorite e-commerce sites, it’s become imperative for brands to constantly review how their products are being represented on the digital shelf. Here’s why:
- Studies suggest that 36% of brands selling on marketplaces don’t have a consistent view of customer behavior
- 24% of brands are worried about competition created by the marketplace’s own products and bias towards private labels
- 26% of brands feel their customers are getting distracted from their products
In this light, brands that are serious about competing online are already harnessing the benefits of digital shelf analytics.
What is digital shelf analytics?
Digital shelf analytics is the process of analyzing digital shelf data to gather specific insights into the way your products are represented online. It offers brands complete visibility of their products to ensure they are always in stock, visible and presented correctly – an activity that’s incredibly time-consuming and effort-intensive.
Fortunately, with publicly available data on the internet and advanced analytics, brands can capture and draw digital shelf insights in real-time. The outcome? Brands can take timely action to improve their competitiveness and brand image online.
Here’s a look at some of the most common data sources Netscribes utilizes for conducting digital shelf analytics:
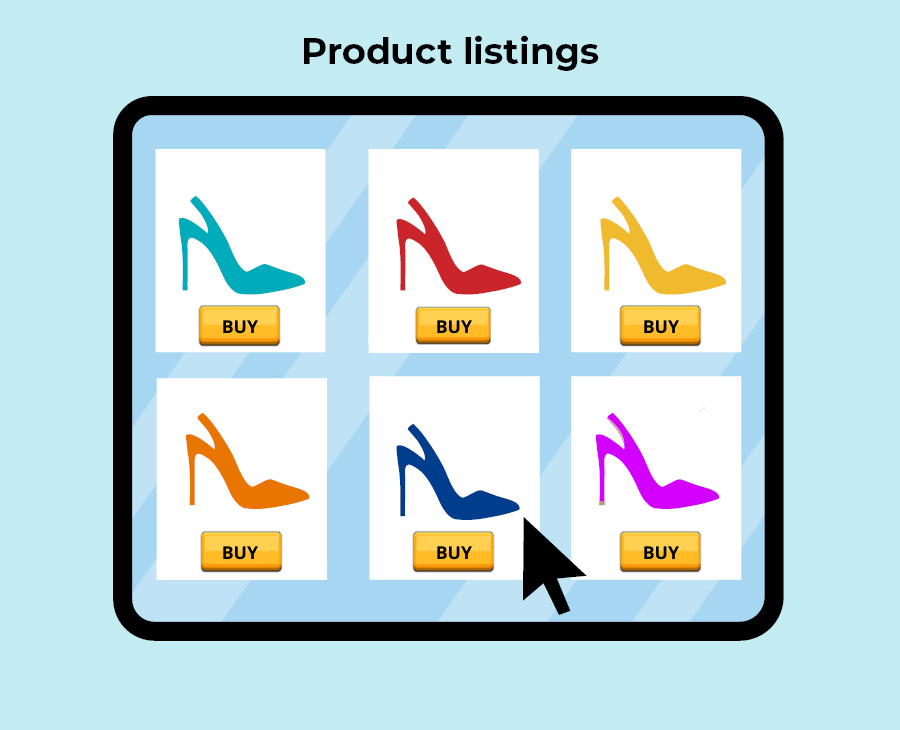
1. Product listings
On which position does your product appear when a customer types in a particular search term? We help capture this data for your product listings on marketplaces. As a brand, this gives you insight into how your products are ranked for specific keywords in comparison to your competition. It also helps measure your product’s discoverability across the digital shelf, and could even help you find a correlation to your sales performance.
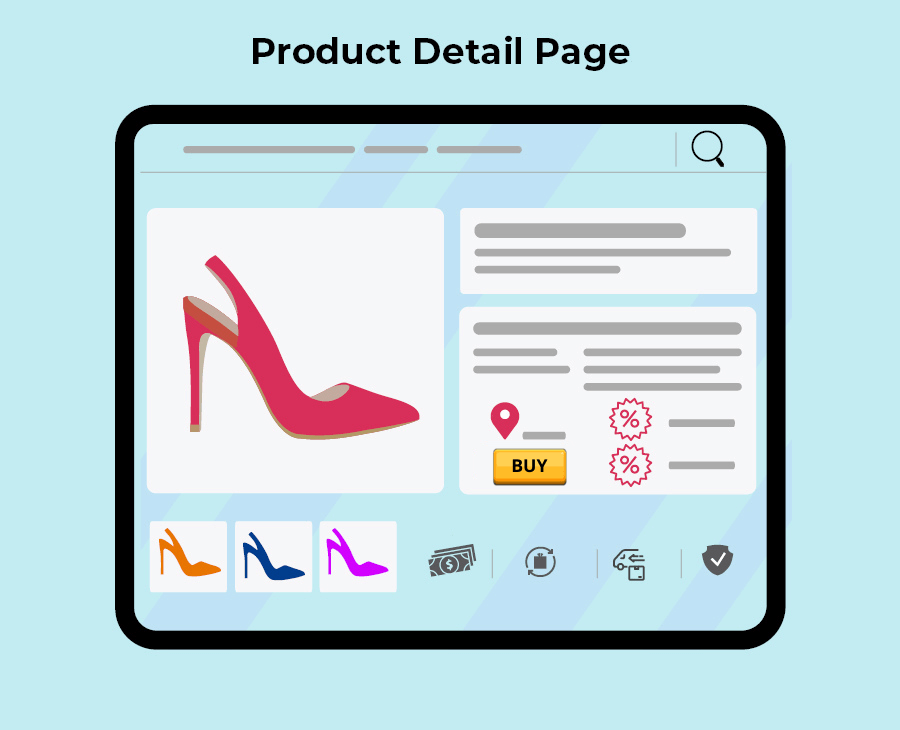
2. Product detail pages (PDP)
Once a particular product listing piques your customer’s interest, they click on it to know more. This leads them to your product detail page. From these pages we capture all product information, including the title, copy, images, price, inventory, etc., to check pricing, availability, and content quality. Brands can use this data to review and ensure consistency across the digital shelf – an aspect that can make or break your customer’s trust.
On the pricing front, the data captured allows brands to monitor their product’s pricing across online marketplaces and third-party retailers, spot MAP violations, and take timely action. They can even track their competitor’s pricing for a particular product to understand their strategies and stay competitive.
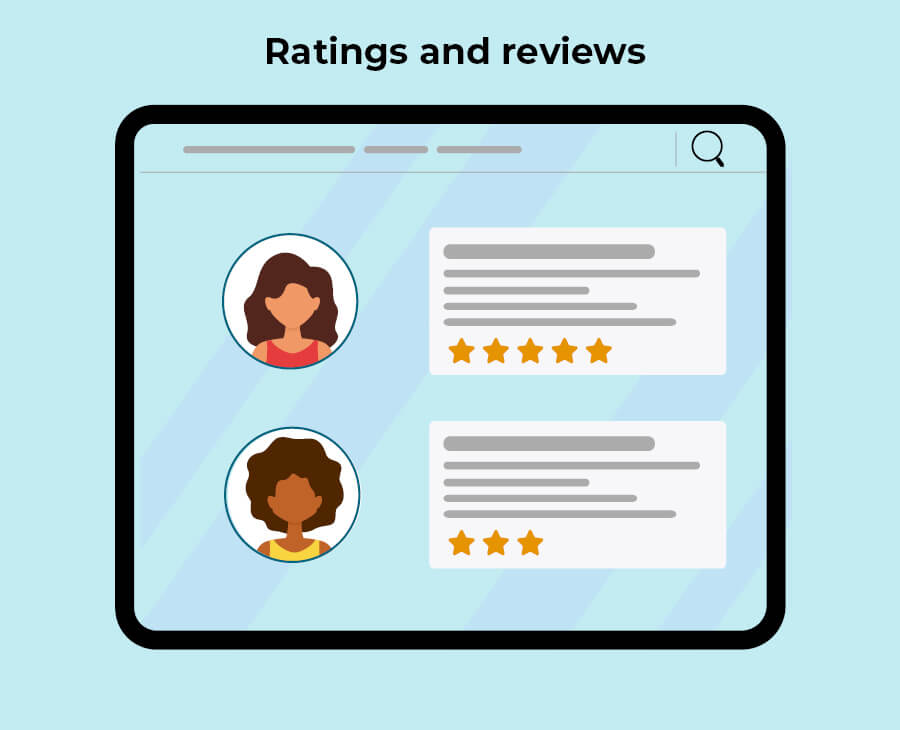
3. Online customer reviews and ratings
Customer ratings and reviews are a rich source of insights. Being the only user-generated data point, we capture this data across each product detail page to help brands understand the buying context, identify features that matter, and the customer sentiment for those features or attributes. This can help further refine your brand messaging and identify gaps in the customer experience.
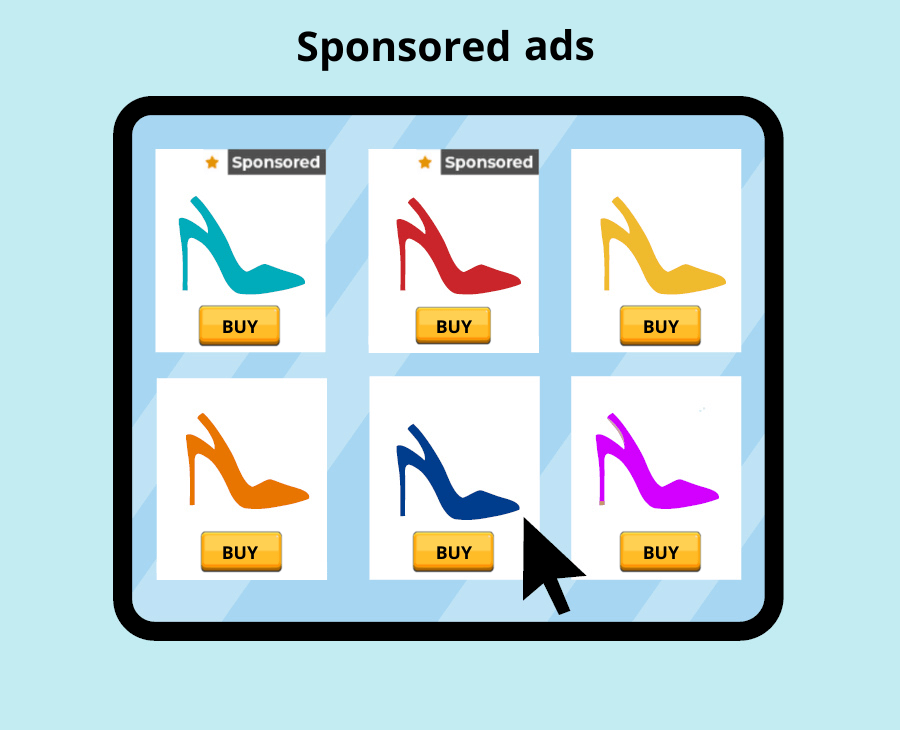
4. Sponsored display ads
For shoppers looking at the search results for a particular product, the first few results are generally sponsored ads. Monitoring how your sponsored products rank in comparison to that of your competitors for popular keywords can help optimize your future holiday promotions better.
How does digital shelf analytics work?
Once this data is collected, validated, and structured, machine-learning algorithms are applied to derive insights into various aspects of your digital shelf. These insights are typically displayed on a dashboard to provide a variety of information and insights into brand compliance. Some of the most common components include:
Price compliance:
- Monitor the prices of specific products over time by each retailer
- Record minimum advertised price (MAP) violations over time
Content compliance:
- Capture product information such as images, title, descriptions etc.
- Record any variations from the client’s branded content
- Variations above a certain threshold are flagged
Assortment compliance:
- Record the products offered by retailers in specific categories
- Monitor product availability over time
Promotion compliance:
- Record the products that appear in Sponsored Ads for popular search terms
- Monitor ranking changes over time
Netscribes’ digital shelf analytics solution is designed to improve the way our clients’ products are represented on the digital shelf. Being a data and insights leader, we leverage our in-house proprietary platform to deliver actionable insights that help you make the right adjustments at the right time, on the right channel. In addition, clients receive scheduled reports about specific data analyses to meet their information and insight needs. To know how we can help your brand win the digital shelf this holiday season and beyond, contact us.